Running Experiments
This tutorial walks through running a complete preprocessing sensitivity experiment.
Overview
We'll:
- Configure preprocessing methods
- Run the classification pipeline
- Analyze results with MLflow
- Compare STRATOS metrics
Step 1: Configure the Experiment
Create a custom configuration:
# configs/my_experiment.yaml
defaults:
  - defaults

# Preprocessing configuration
outlier_method: MOMENT-gt-finetune
imputation_method: SAITS

# Classifier (keep fixed for preprocessing analysis)
classifier: CatBoost

# Bootstrap settings
CLS_EVALUATION:
  BOOTSTRAP:
    n_iterations: 1000
Step 2: Run the Pipeline
# Activate environment
source .venv/bin/activate

# Run with custom config
python -m src.classification.flow_classification \
    --config-name=my_experiment
Step 3: Monitor Progress
Watch the experiment at http://localhost:5000.
The MLflow Tracking UI shows all experiment runs with their parameters and metrics:
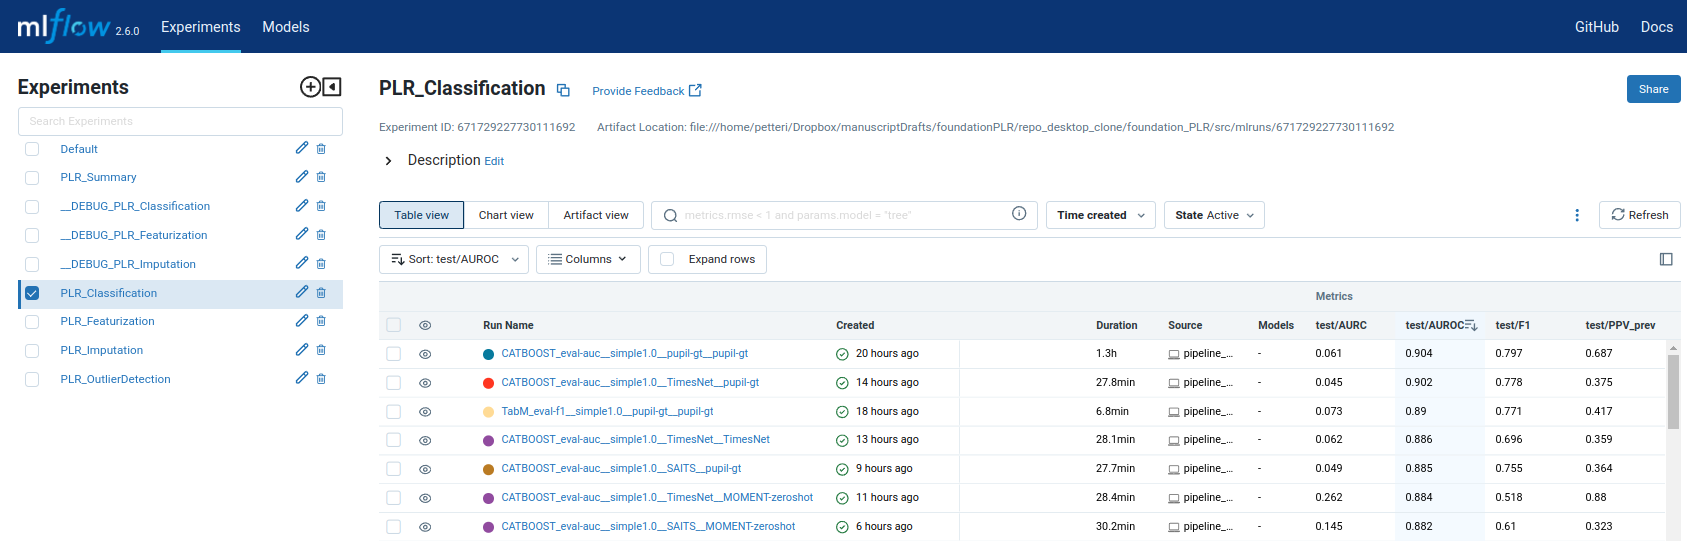
MLflow Tracking UI at localhost:5000 — compare preprocessing configurations side-by-side.
Step 4: Compare Results
View Metrics
In MLflow UI:
- Select experiments to compare
- Click "Compare"
- View STRATOS metrics side-by-side
Each run stores its artifacts (model files, predictions, configuration) in the MLflow Artifact Store:
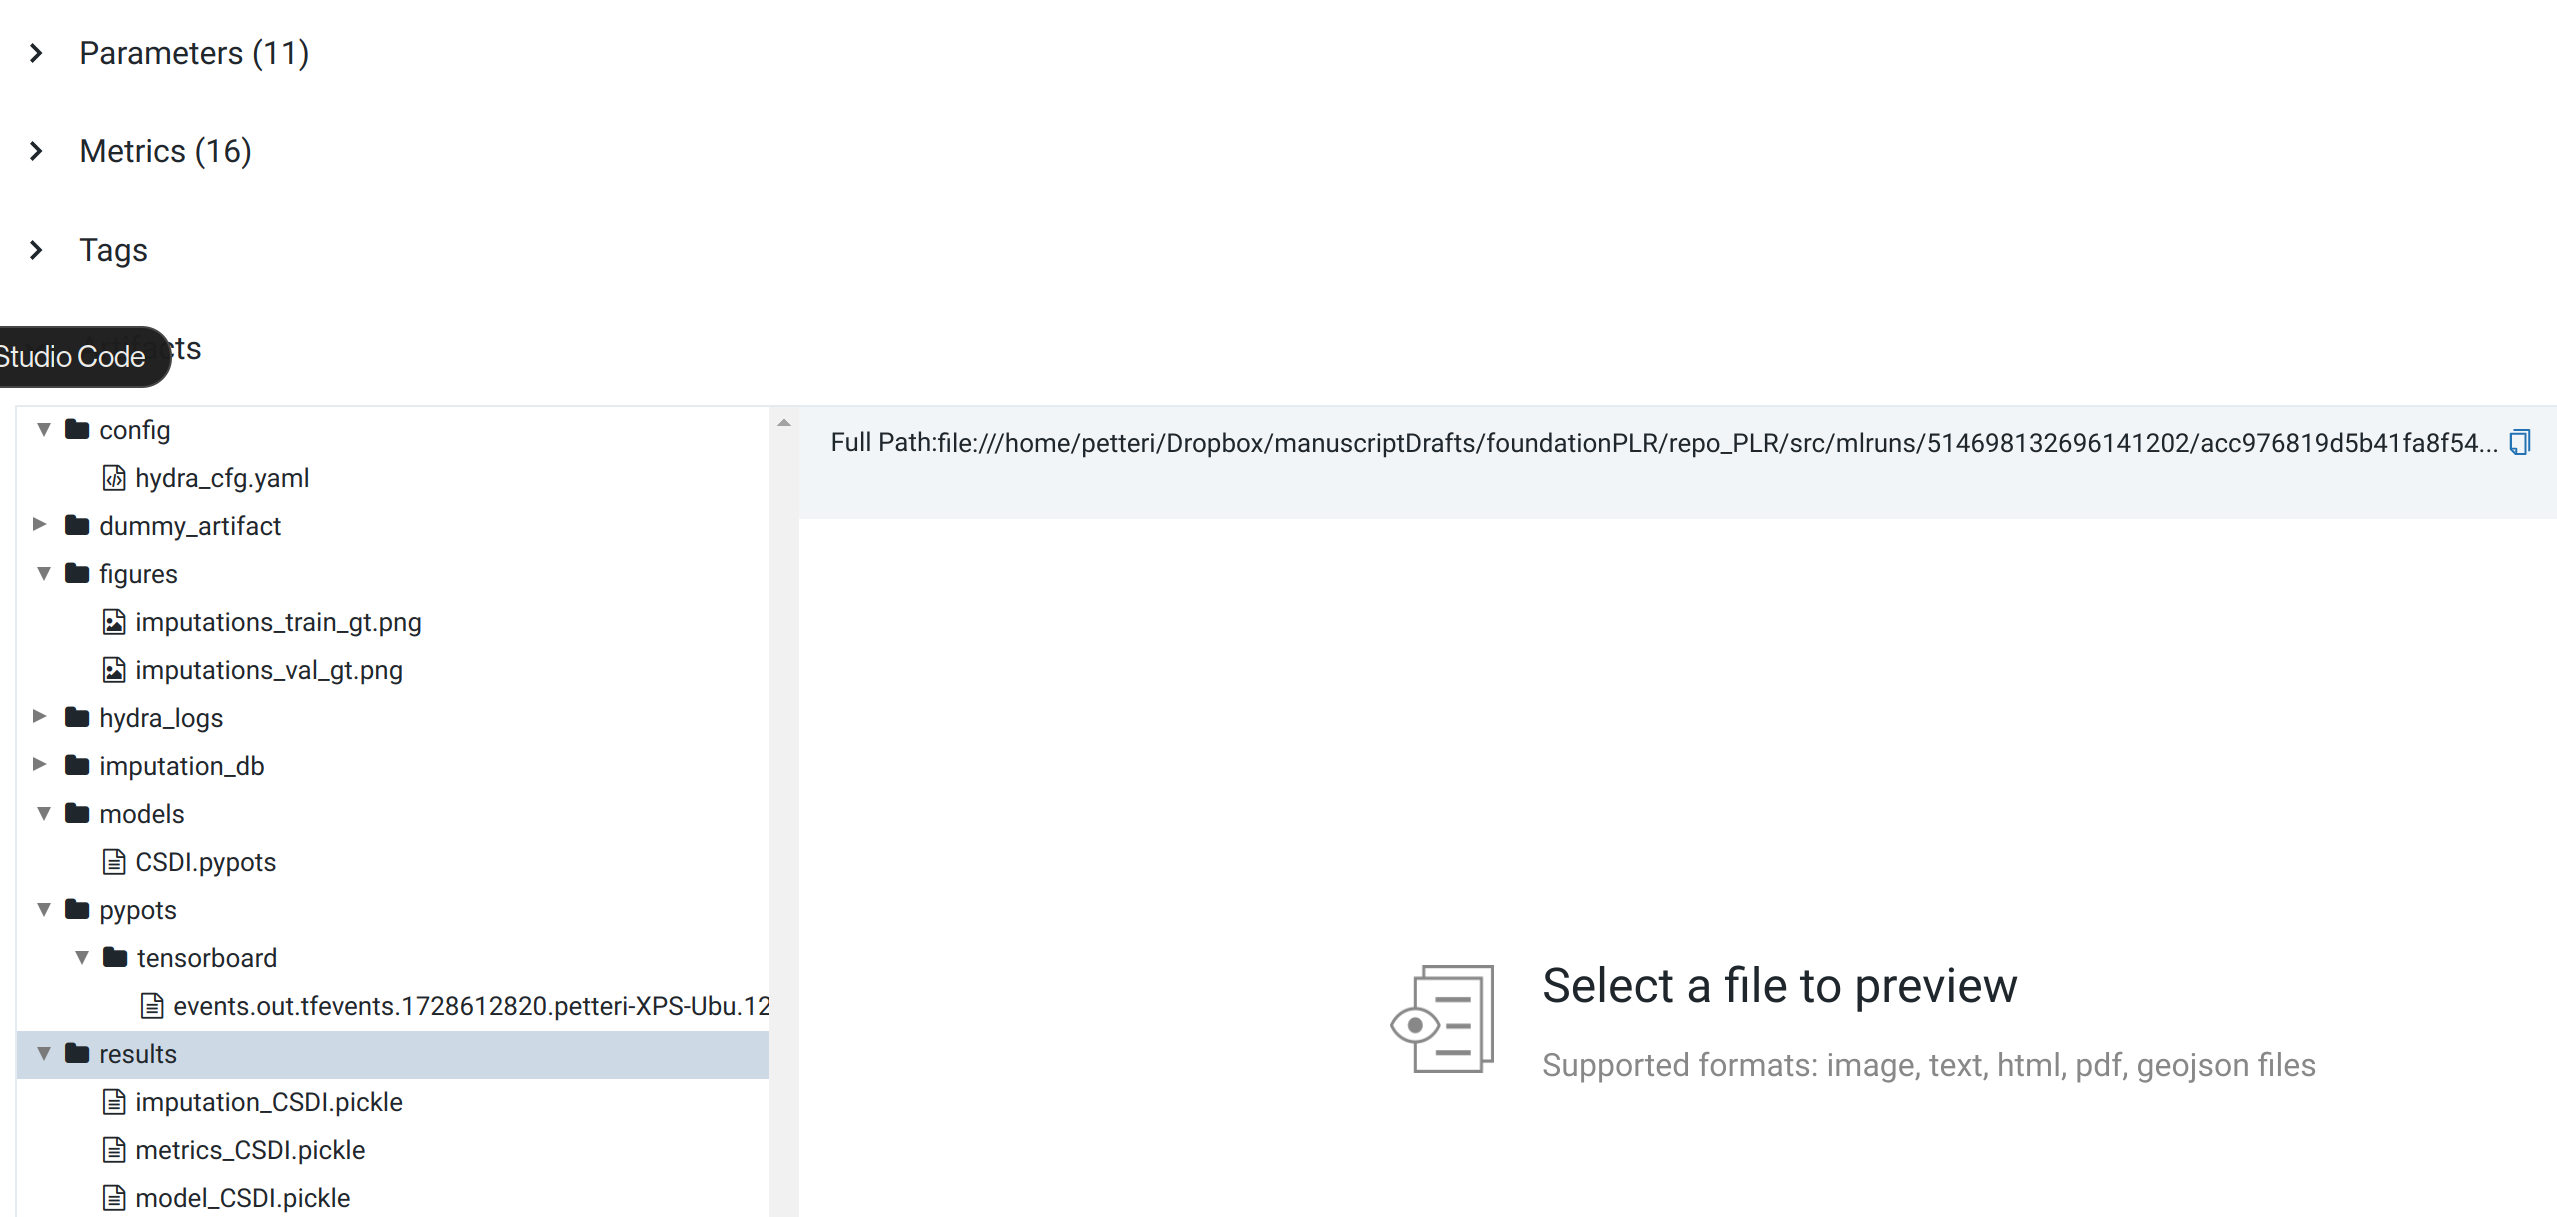
MLflow Artifact Store — each run preserves the full experiment context for reproducibility.
Export Results
# Export to DuckDB for analysis
python -m src.data_io.duckdb_export export \
    --mlruns /home/petteri/mlruns \
    --output results.db
Step 5: Analyze STRATOS Metrics
The pipeline computes all STRATOS-compliant metrics:
| Metric | Description | Target |
|---|---|---|
| AUROC | Discrimination | Higher better |
| Brier | Overall performance | Lower better |
| Calibration slope | Should be ~1.0 | Close to 1.0 |
| Net Benefit | Clinical utility | Higher better |
Next Steps
- Try different preprocessing combinations
- Learn how to add new methods