Conformal Prediction
When the system says "90% confident," it must actually be right 90% of the time -- not 60% with optimistic rounding.
The Simple Version
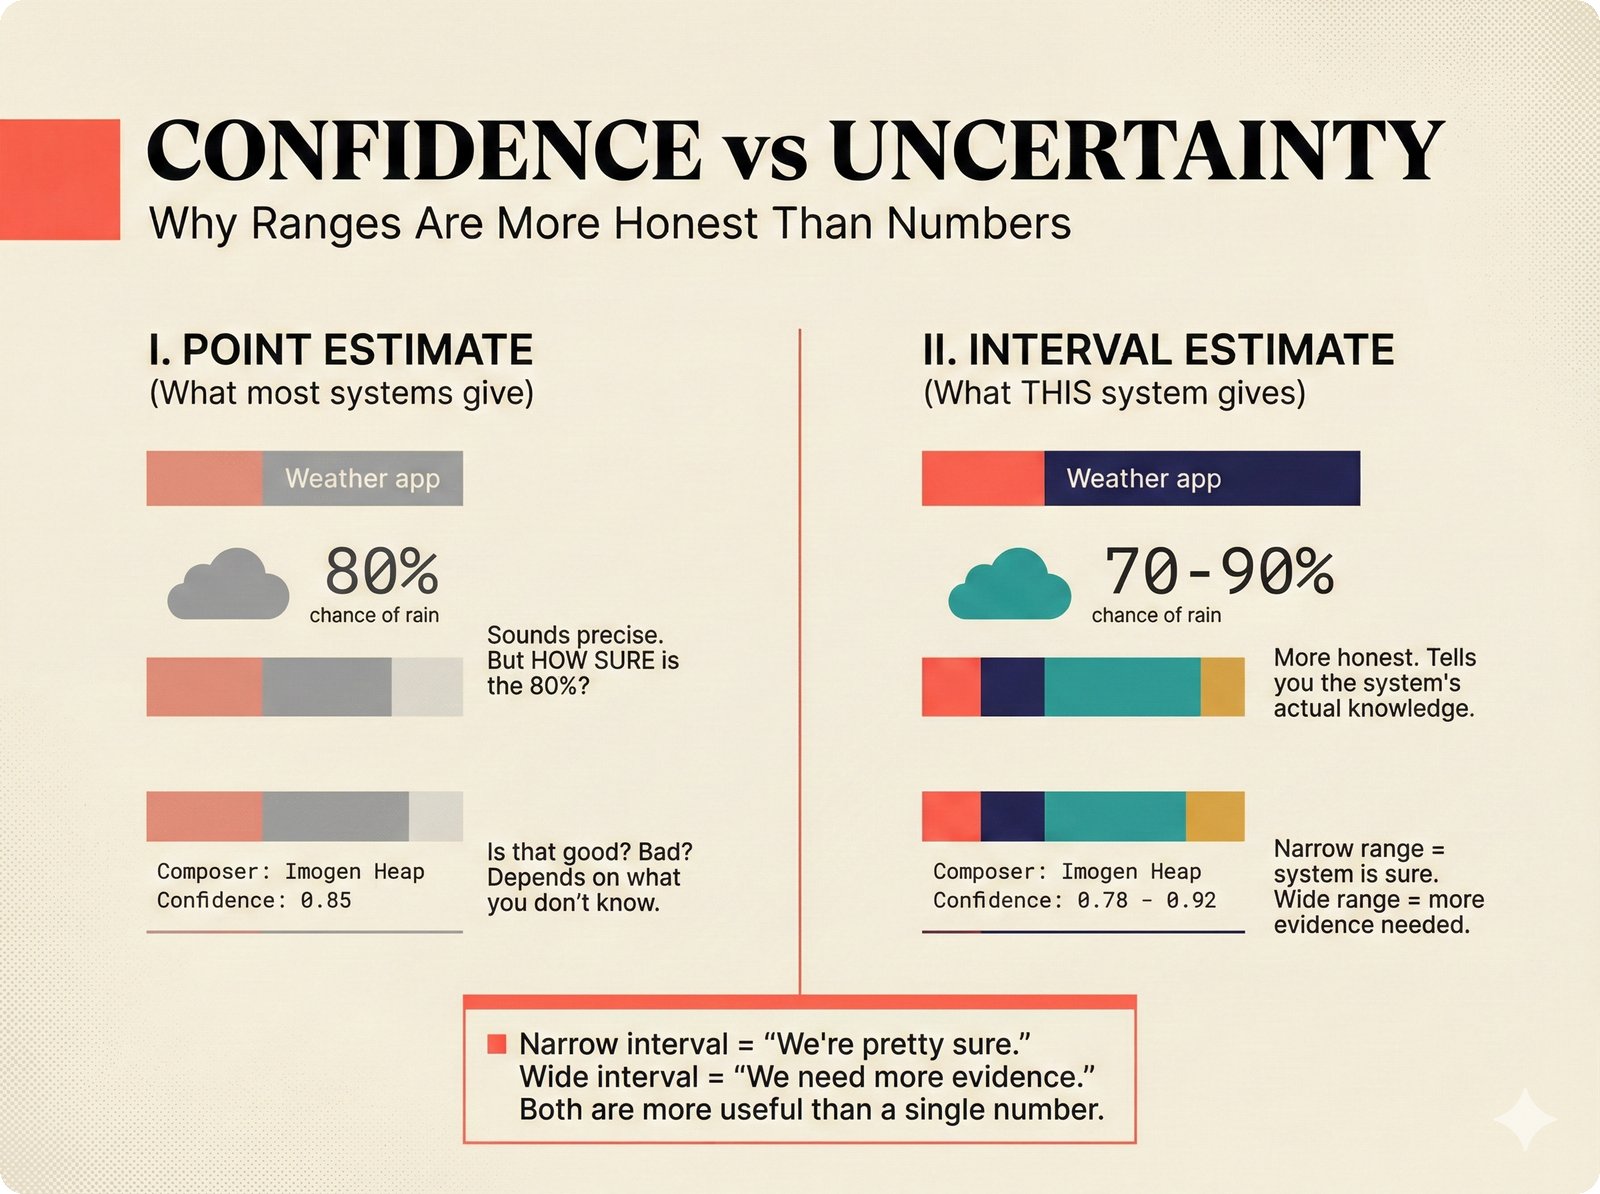
Figure 11. Confidence versus uncertainty: a single number (0.85) hides how much the system actually knows, while an interval (0.78-0.92) communicates both the estimate and its uncertainty -- this scaffold uses interval estimates because they are more honest and actionable for music attribution decisions.
Think about weather forecasts. A good forecaster does not just say "it will rain tomorrow." They say "there is a 70% chance of rain, and we are calibrated -- when we say 70%, it actually rains about 70% of the time."
A bad forecaster says "90% chance of sun!" every day, even when it rains half the time. They are overconfident -- their stated confidence does not match reality.
Music attribution has the same problem. A system might say "we are 85% confident Imogen Heap wrote this song," but if you checked all the claims it made at 85% confidence, only 60% would be correct. That 85% number would be meaningless.
Conformal prediction fixes this. Instead of giving a single confidence number, it gives a prediction set -- a list of possible answers that is guaranteed to contain the correct one at a specified rate. If you ask for 90% coverage, the set will contain the right answer at least 90% of the time. This guarantee holds regardless of the underlying model.
The Forecast Analogy in Practice
Instead of "85% chance it's sunny," conformal prediction says: "Tomorrow's weather will be one of {sunny, partly cloudy} with 90% coverage." The set might be larger when the model is uncertain (more options) and smaller when it is confident (fewer options). But the coverage guarantee holds.
For Music Industry Professionals
Why Intervals Beat Point Estimates
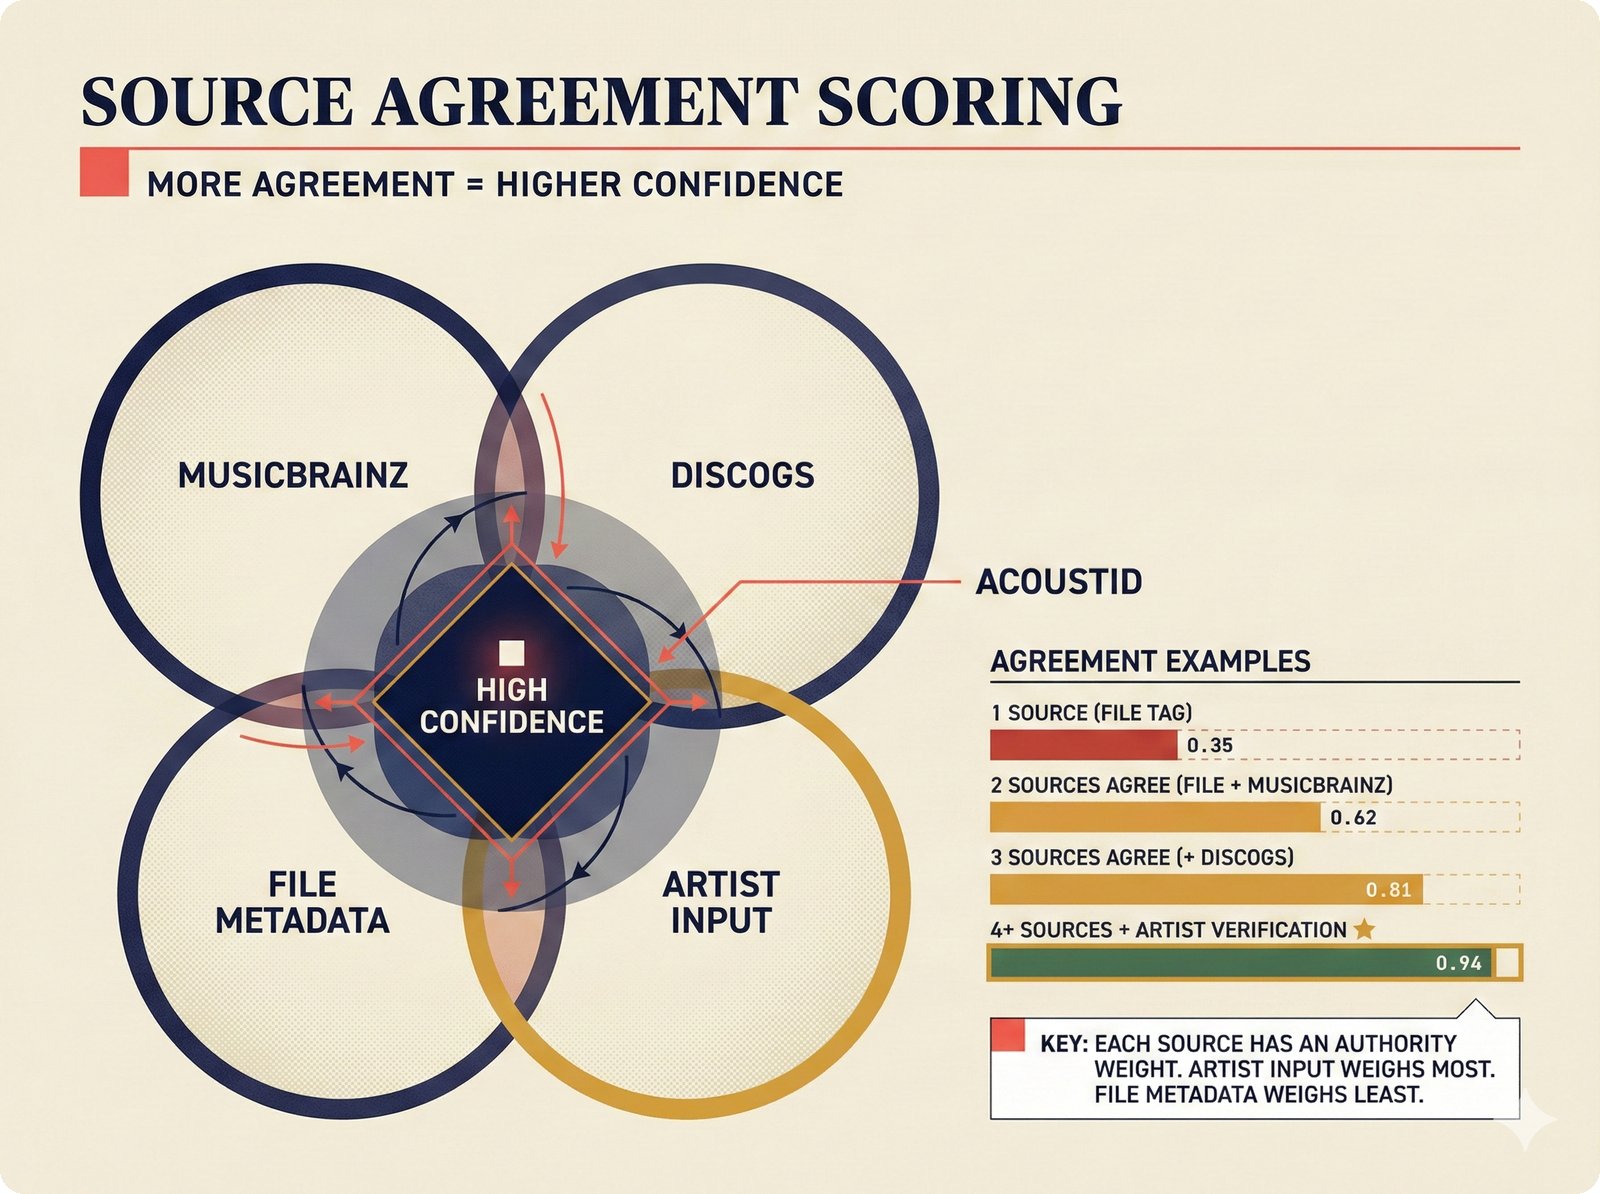
Figure 14. Source agreement scoring: confidence increases with independent corroboration across weighted data sources. A single file tag yields 0.35, while four sources plus artist verification reaches 0.94, with artist input carrying the highest authority weight in the attribution scaffold.
When a rights manager sees "confidence: 0.72" on an attribution record, they need to know:
- Is 0.72 good enough to act on? That depends on whether the system's 0.72 actually means 72% accuracy.
- What are the alternatives? If the system is not sure about the songwriter role, what other roles are plausible?
- How much should I trust this number? Has the system been calibrated against known-correct data?
Point estimates (a single number like 0.72) answer none of these questions. Conformal prediction answers all three:
Instead of "this person is the songwriter (72% confidence)," the system says:
"At 90% coverage, the prediction set for this credit is {SONGWRITER, COMPOSER}. The set contains the correct role at least 90% of the time across all records."
A small set (1--2 roles) means the system is confident. A large set (4+ roles) means the system is uncertain and the record needs human review.
The 90% coverage level is a statistical guarantee, not an aspiration. If the system produces 1,000 prediction sets at 90% coverage, at least 900 of them will contain the correct answer. This is verifiable by auditing past predictions.
The scaffold tracks Expected Calibration Error (ECE) -- how far off the system's confidence is from actual accuracy. An ECE of 0.02 means the system is well-calibrated. An ECE of 0.15 means stated confidence is unreliable.
What This Means for Review Queues
Prediction set size directly drives the review queue:
| Set Size | Meaning | Action |
|---|---|---|
| 1 role | System is highly confident | Auto-accept (with audit trail) |
| 2--3 roles | System has narrowed it down | Quick human review |
| 4+ roles | System is uncertain | Deep review needed |
The Imogen Heap Example
For "Hide and Seek" (confidence 0.95, A3 assurance), the conformal set at 90% coverage is {PERFORMER, SONGWRITER, PRODUCER} -- three roles, high certainty. For "Blanket" (confidence 0.00, A0 assurance), the set is {PERFORMER, SONGWRITER, PRODUCER, COMPOSER, LYRICIST, ENGINEER} -- the system genuinely does not know.
For Engineers
Nonconformity Scores and APS
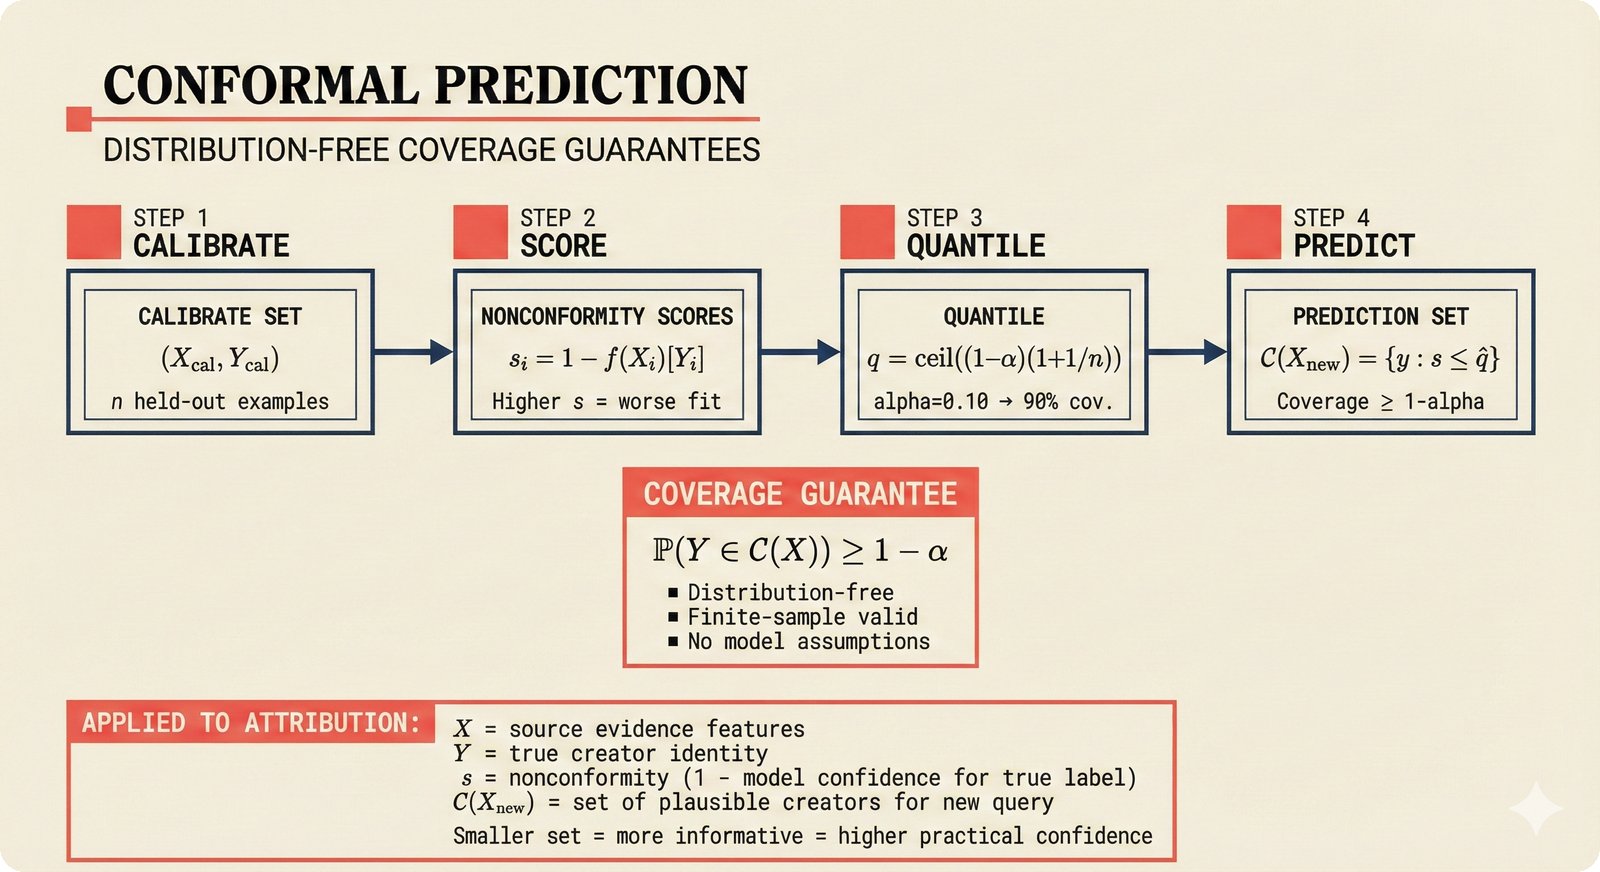
Figure 12. Conformal prediction pipeline: held-out calibration data produces nonconformity scores, which yield a quantile threshold that generates prediction sets with formal coverage guarantees -- applied to music attribution where X represents source evidence features and C(X_new) is the set of plausible creators for a query.
The scaffold implements the Adaptive Prediction Sets (APS) method in src/music_attribution/attribution/conformal.py. The core algorithm:
- Sort candidate roles by confidence (descending)
- Add roles to the prediction set until cumulative confidence reaches the target coverage
- Compute marginal coverage and calibration error
# From src/music_attribution/attribution/conformal.py
class ConformalScorer:
    def score(
        self,
        predictions: list[tuple[CreditRoleEnum, float]],
        coverage: float = 0.90,
    ) -> ConformalSet:
        # Sort by confidence descending
        sorted_preds = sorted(predictions, key=lambda x: x[1], reverse=True)

        # Build prediction set until cumulative >= coverage
        prediction_set: list[CreditRoleEnum] = []
        cumulative = 0.0
        for role, conf in sorted_preds:
            prediction_set.append(role)
            cumulative += conf
            if cumulative >= coverage:
                break

        # Calibration error = |achieved_coverage - target_coverage|
        marginal = min(cumulative / total_conf, 1.0)
        cal_error = abs(marginal - coverage)
        ...
The ConformalSet Schema
The prediction set is stored as a first-class field on every AttributionRecord:
# From src/music_attribution/schemas/attribution.py
class ConformalSet(BaseModel):
    coverage_level: float          # Target coverage (e.g., 0.90)
    prediction_sets: dict[str, list[CreditRoleEnum]]  # Named sets
    set_sizes: dict[str, int]      # Size of each set
    marginal_coverage: float       # Achieved coverage
    calibration_error: float       # |marginal - target|
    calibration_method: str        # "APS"
    calibration_set_size: int      # Number of calibration examples
Calibration Pipeline
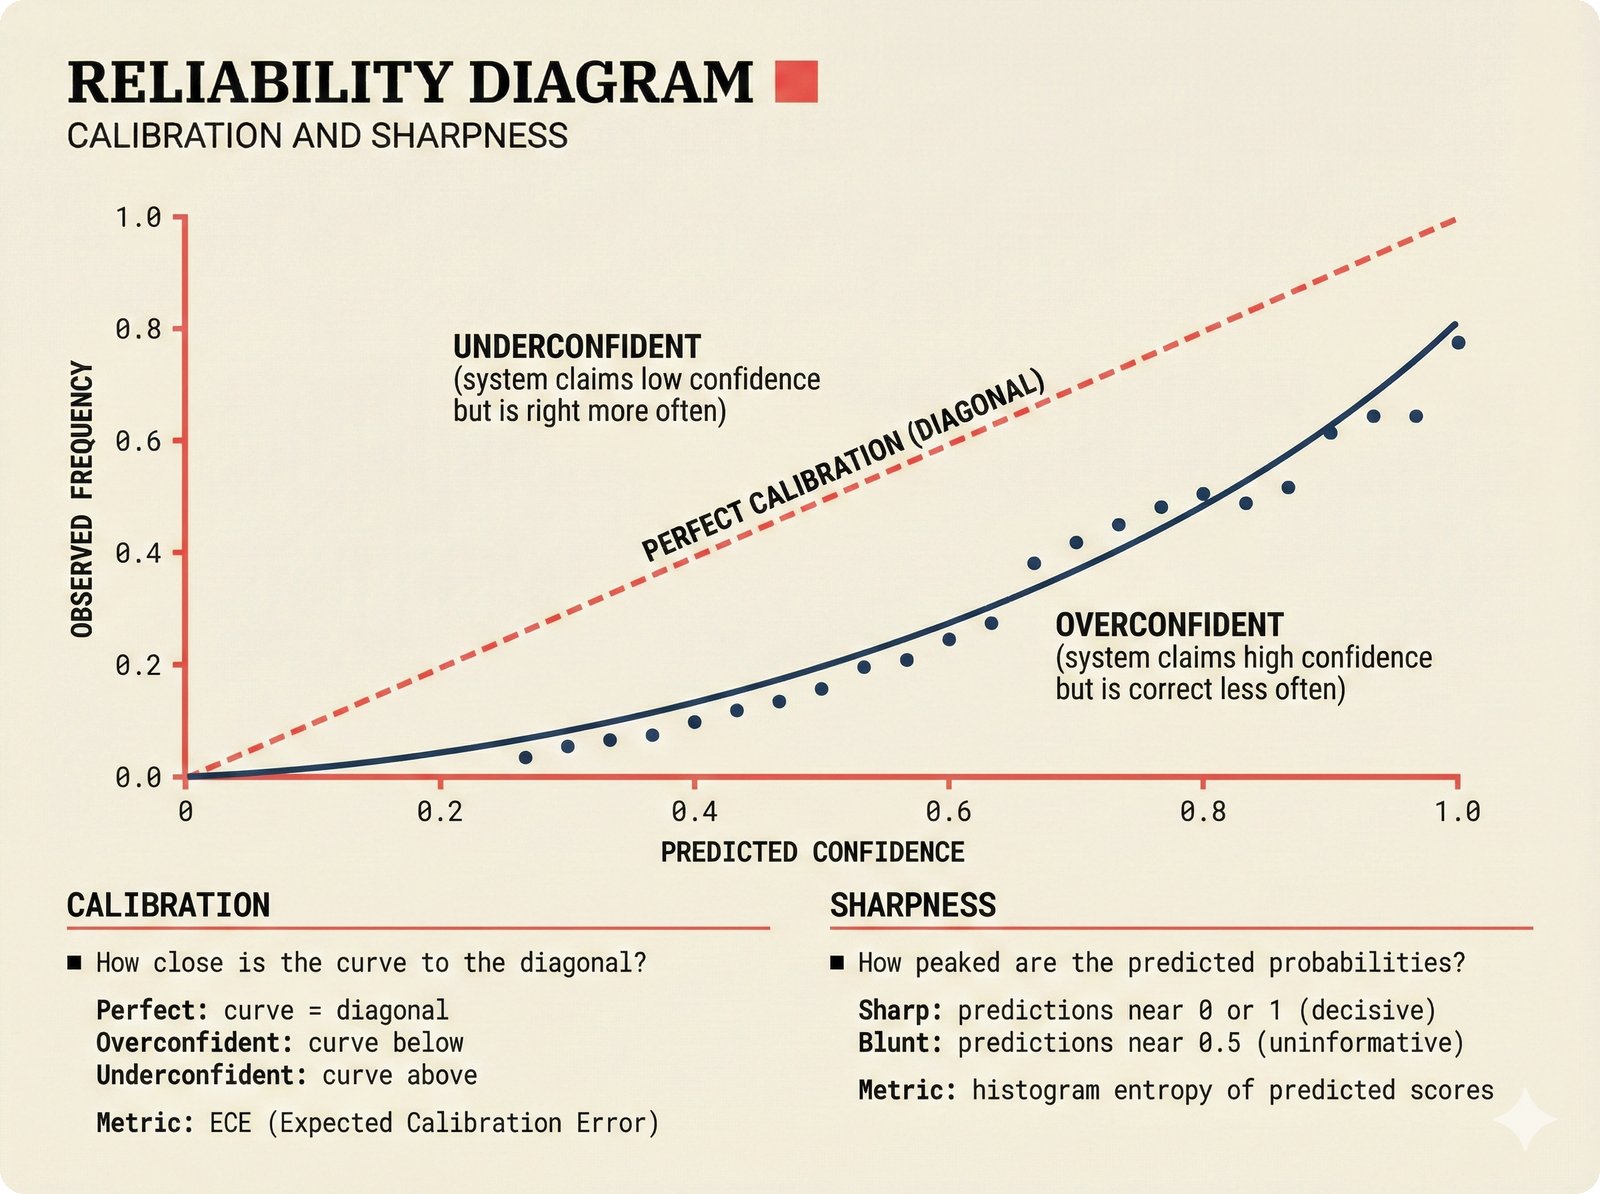
Figure 13. Reliability diagram for confidence calibration: when the attribution system says "85% confident," it should be correct 85% of the time. Deviations below the diagonal indicate overconfidence, while deviations above indicate underconfidence -- both calibration and sharpness must be evaluated for trustworthy music attribution.
graph LR
    A[Historical<br/>Predictions] -->|predicted prob,<br/>actual outcome| B[CalibrationReport]
    B -->|ECE, bin metrics| C{ECE < 0.05?}
    C -->|Yes| D[Well-Calibrated<br/>Trust the scores]
    C -->|No| E[Recalibrate<br/>Adjust thresholds]

    B --> F[OverconfidenceReport]
    F -->|overconfidence_gap| G{gap > 0.1?}
    G -->|Yes| H[Flag as<br/>overconfident]
    G -->|No| I[Acceptable]

    style D fill:#e8f5e9,stroke:#2e7d32
    style E fill:#ffebee,stroke:#c62828
    style H fill:#fff3e0,stroke:#e65100
    style I fill:#e8f5e9,stroke:#2e7d32
The ConformalScorer.calibrate() method produces a CalibrationReport with:
- ECE (Expected Calibration Error): Weighted average of |accuracy - confidence| across 10 bins
- Per-bin metrics: Accuracy and mean confidence for each decile
- Marginal coverage: What fraction of predictions were actually correct
Uncertainty-Aware Provenance
The scaffold goes beyond simple conformal sets with a full uncertainty framework:
Each pipeline step decomposes uncertainty into intrinsic (data noise) and extrinsic (model/pipeline noise):
Optional fine-grained decomposition across four dimensions:
Tracks how confidence evolves across pipeline steps:
Detects when stated confidence systematically exceeds actual accuracy:
SConU and Confidence Methods
The ConfidenceMethodEnum tracks how each confidence score was produced:
| Method | Description | Reliability |
|---|---|---|
SELF_REPORT |
Model's own stated confidence | Low -- often overconfident |
MULTI_SAMPLE |
Agreement across multiple samplings | Medium |
LOGPROB |
Token log-probabilities | Medium (LLM-specific) |
ENSEMBLE |
Agreement across model ensemble | High |
CONFORMAL |
Conformal prediction calibrated | High -- coverage guarantee |
SOURCE_WEIGHTED |
Weighted by source reliability | Medium-High |
HUMAN_RATED |
Human expert assessment | Highest |
HTC |
Trajectory-level calibration (Zhang 2026) | High |
Key Source Files
| File | Role |
|---|---|
src/music_attribution/attribution/conformal.py |
ConformalScorer with APS scoring and calibration |
src/music_attribution/schemas/attribution.py |
ConformalSet schema on every AttributionRecord |
src/music_attribution/schemas/uncertainty.py |
Full uncertainty framework (UProp, 4-D, HTC, overconfidence) |
src/music_attribution/schemas/enums.py |
ConfidenceMethodEnum, CalibrationStatusEnum, ConfidenceTrendEnum |
src/music_attribution/constants.py |
Confidence tier thresholds (0.85 high, 0.50 medium) |
How This Maps to Code
Conformal prediction flows through the attribution pipeline:
- Entity Resolution produces per-method confidence scores (string similarity, embedding, etc.)
- Credit Aggregation computes weighted confidence from source reliabilities
- Conformal Scorer wraps point estimates in calibrated prediction sets
- Uncertainty Summary attaches step-level decomposition and overconfidence detection
- API/Frontend exposes prediction set size as a visual signal (small set = confident, large set = uncertain)
Paper Citation
"A confidence score without calibration is a number without meaning. Conformal prediction provides the missing semantics: when the system says 90%, it means 90%." -- Teikari (2026), Section 4.2